Tricksy Knitter chartmaker
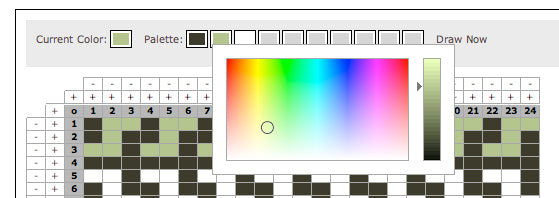
The Tricksy Knitter chartmaker was an online tool designed by me and built by my DH Charles in 2010. We retired it in 2017. It was a wonderfully cool tool for creative knitters, and it was bittersweet to retire it. But technology is a demanding master/mistress and we didn't have the time to maintain it.
Thanks to everyone who supported the chartmaker!